The term ecosystems has become an often mentioned term in the language of business strategy and although a considerable amount has been written and said about what a business ecosystem consists of and why it is very important, little has been written about the vital role that visualisation must play in order to design, model and implement a successful business ecosystem.
The ongoing and future critical impact that ecosystems will play on Business Models across all sectors has been well documented by a wide range of analysts from Gartner, Forester, Accenture, Deloitte, PWC and a wide range of leading academic thinkers.
In this post I will share my thoughts on why I believe that the use of Visualisation is a key technique that must be used in order for all stakeholders to fully understand the structure, impact, value and ultimately the success of a business ecosystem.
Although there are a variety of different definitions for a business ecosystem; I like to describe it as
A Dynamic network of entities interacting with each other to create and exchange sustainable value to all participants”
Visualise roles stakeholders play within the Ecosystem
The entities or stakeholders within an Ecosystem can be people, departments, organizations or things and each will play one or more role in the ecosystem. There are various techniques that can be used to visualise this:
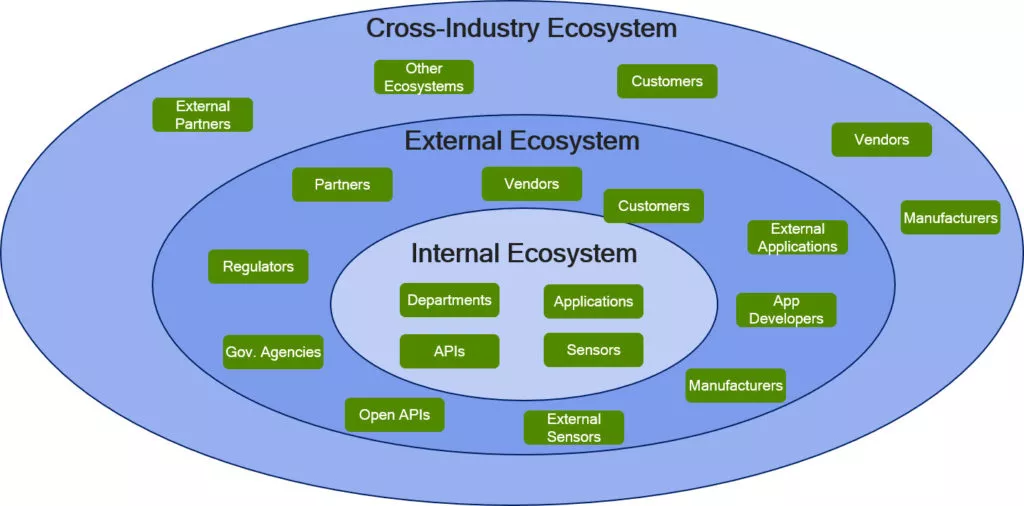
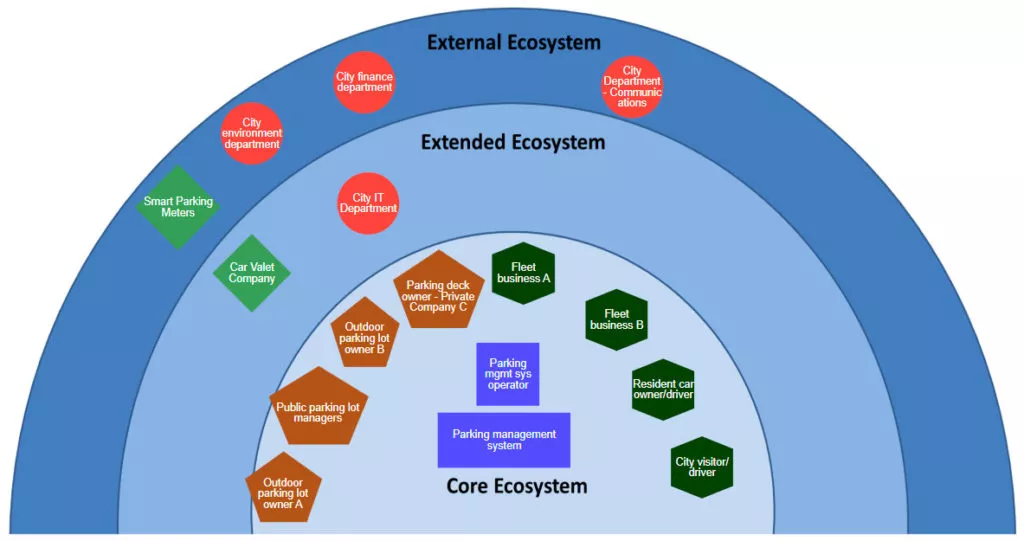
The visualisation of Stakeholder roles can help greatly assist in determining the type, frequency and importance of the stakeholder interactions across the entire ecosystem.
See the interactions
It is extremely difficult if not impossible to model and design an ecosystem using words alone. The saying “a picture paints a thousand words” is so true when referring to an ecosystem. It is essential that all key stakeholders fully understand the complexity of the ecosystem, and using a picture will help significantly to accomplish this goal.
To ensure there is consistency when I am designing an ecosystem, I use the following types of interactions:
- Products & Services: What are the products & Services that will be provided by, provide to or provided through the stakeholders
- Financial: What type of financial interactions will take place (e.g. Shared Revenue model, Cash, etc.)
- Data: What type of data will be sent and how (i.e. what Open API will be used?)
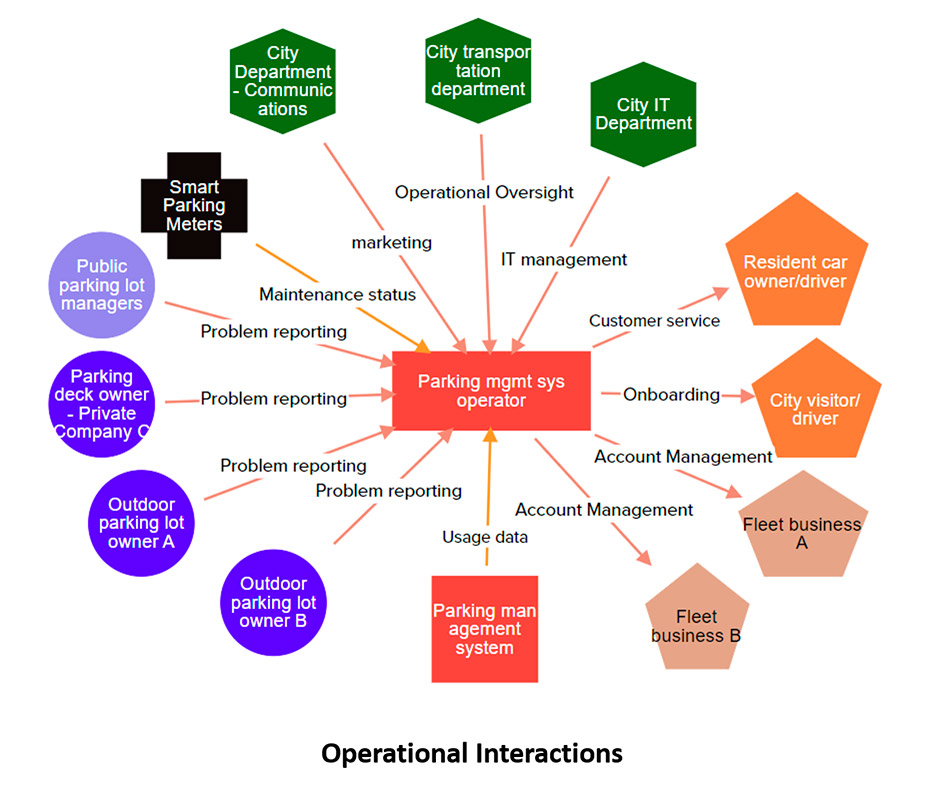
- Operational: What level of operational interactions need to take place between the stakeholders?
- Contractual:What contracts, SLAs or other agreement type documents need to be in place
It is through these interactions that sustainable value will be delivered to all participants.
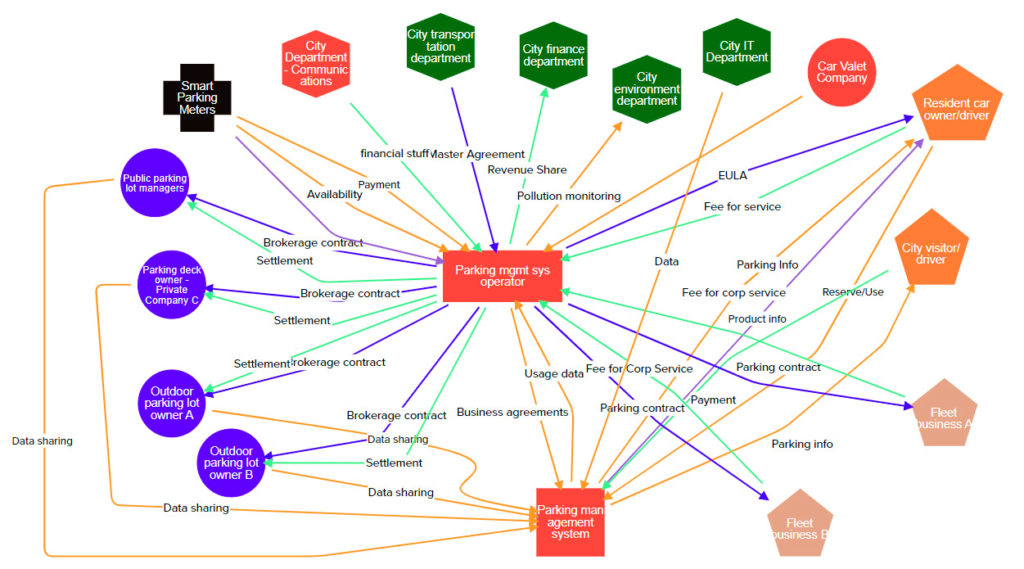
For complex ecosystems, separate ecosystem diagrams can be modelled to represent the different types of interactions.
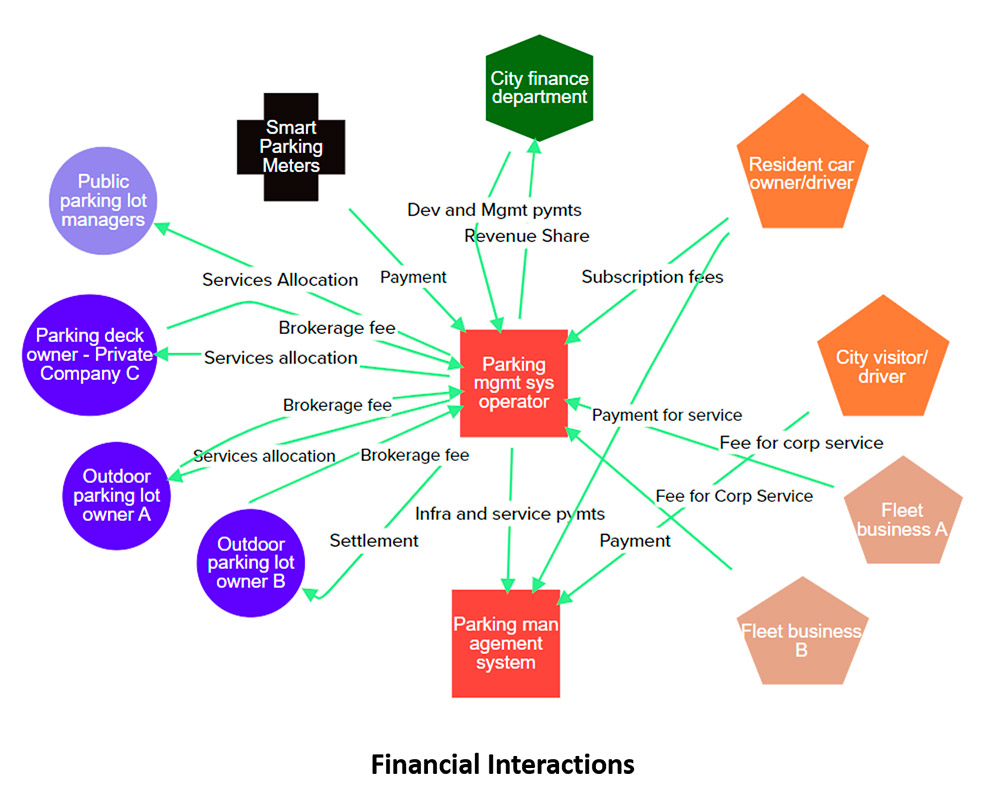
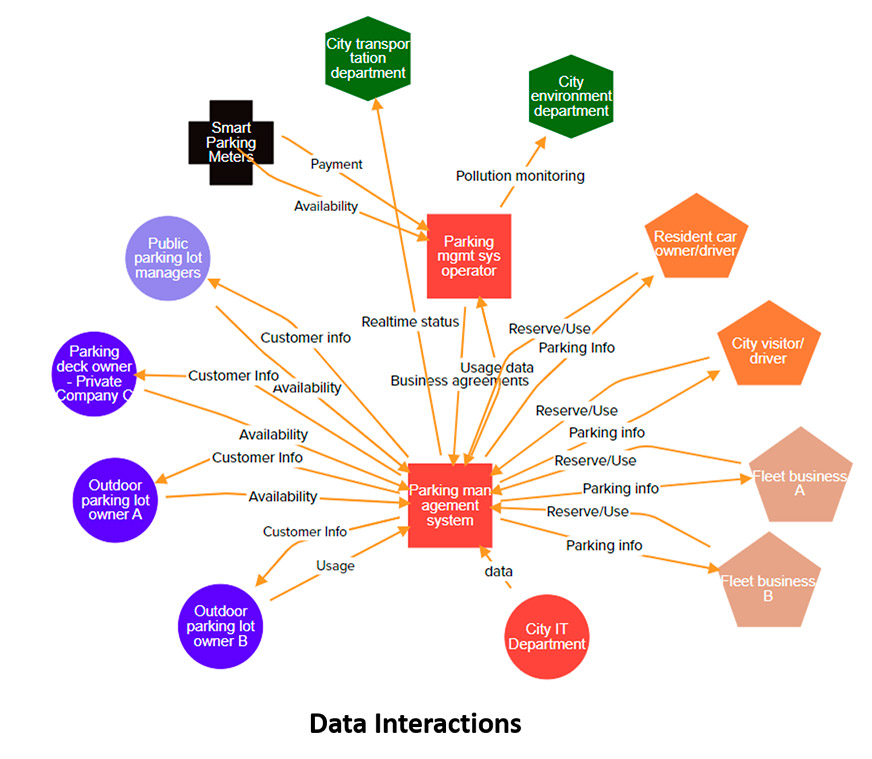
Seeing what is not there
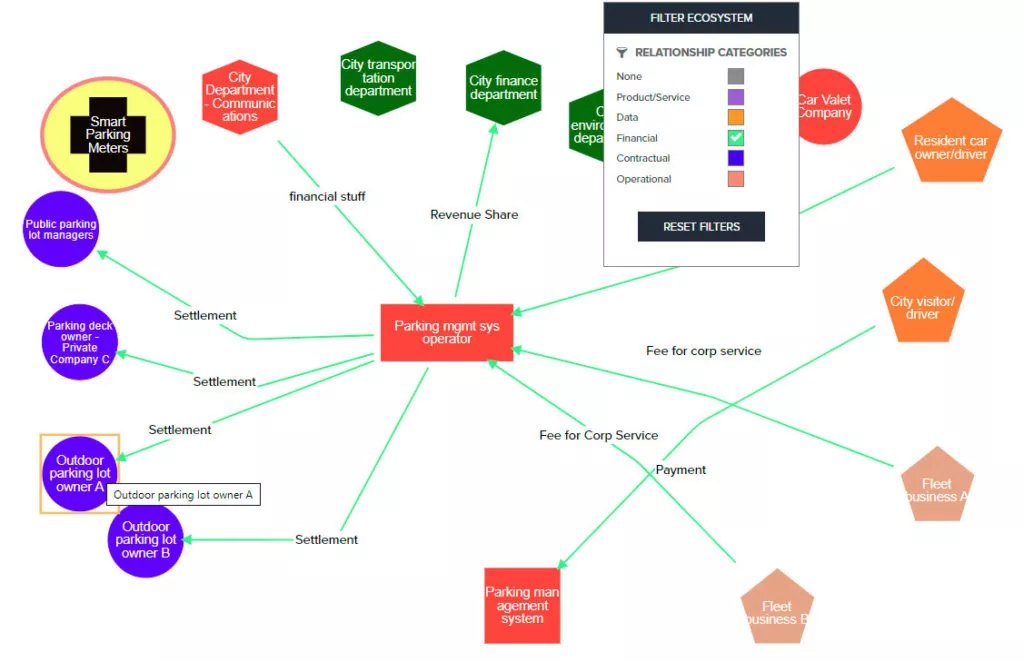
Ecosystem diagrams are created iteratively. I recommend that people start with the known items and those items that are closest to them and then gradually build the ecosystem outwards. Throughout this process it is important to test and validate the model. By the use of filtering you will be able to identify gaps and see interactions that are missing.
The impact, dependency and assignment of Stakeholders across all contributing elements to the Business ecosystems can also be visualised through a Stakeholder Map.
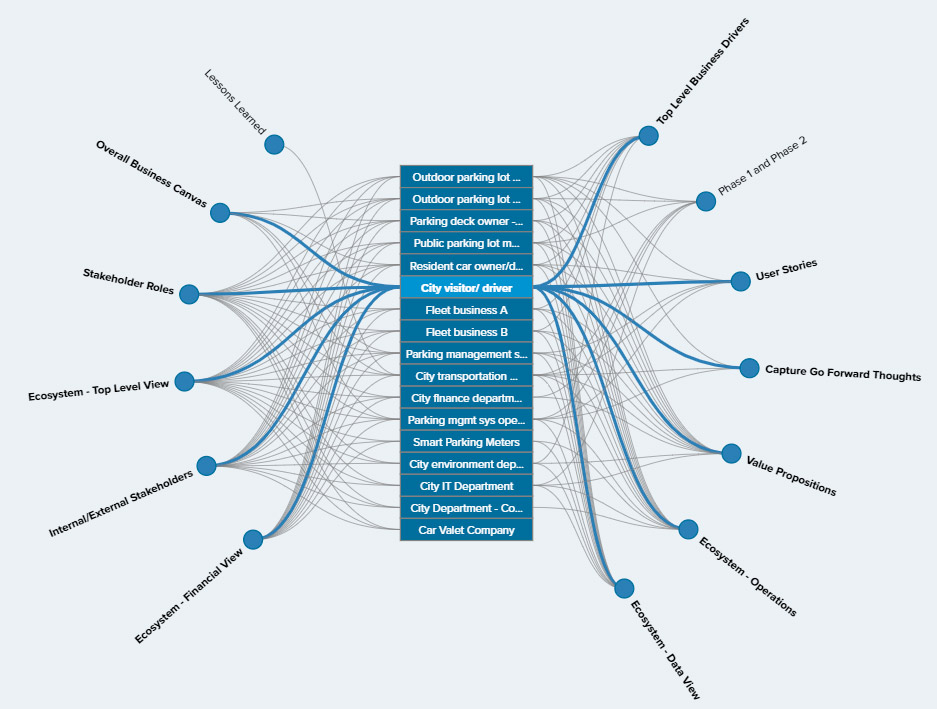
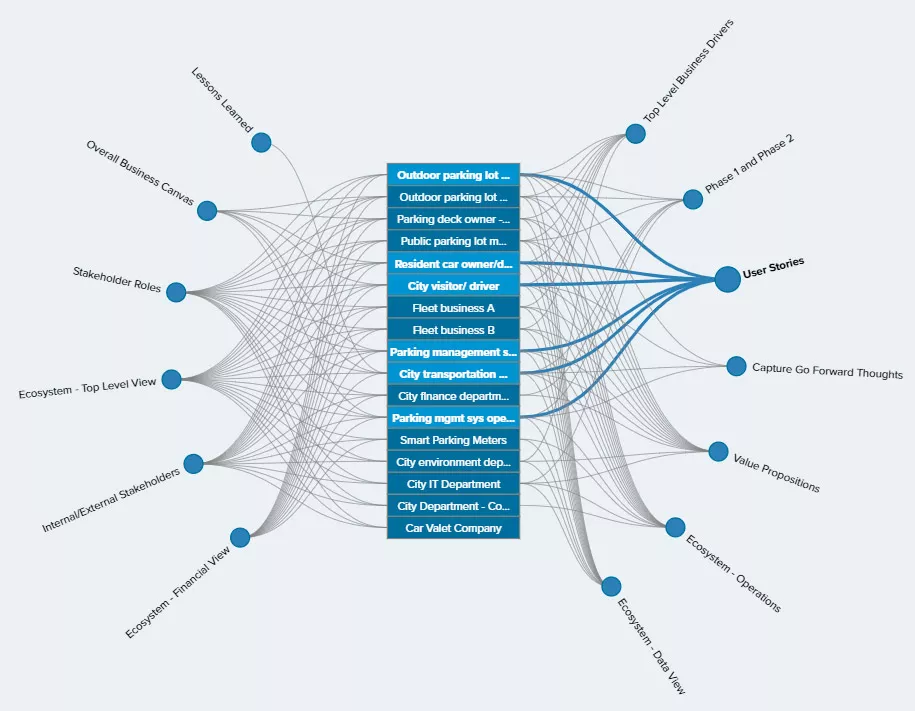
Not only does this show the elements each Stakeholder is mapped to, it can also highlight gaps or missing assignments.
Visualisation will provide key benefits whether you are modelling an existing business ecosystem or designing a new one. Visualisations will enable you to better collaborate and communicate the content, and ultimately enable others to fully understand the ecosystem which will reduce effort, improve efficiencies and enable you and your team to gain approval quicker – all of which will save time and money! A recent survey of users of our Business ecosystem modelling tool reported that they can design their ecosystems up to 70% quicker, and gain approval from their stakeholders 30% quicker.

